Acknowledging Digital Media in Early Childhood
As we shared in our previous post, Wish You Well as Digital Literacy: NAEYC Reflection, we had the privilege of attending and presenting at the NAEYC 2022 Annual Conference in Washington DC in November. We were excited for a new opportunity to grow in the area of technology integration, with a true focus on best practices with young children.
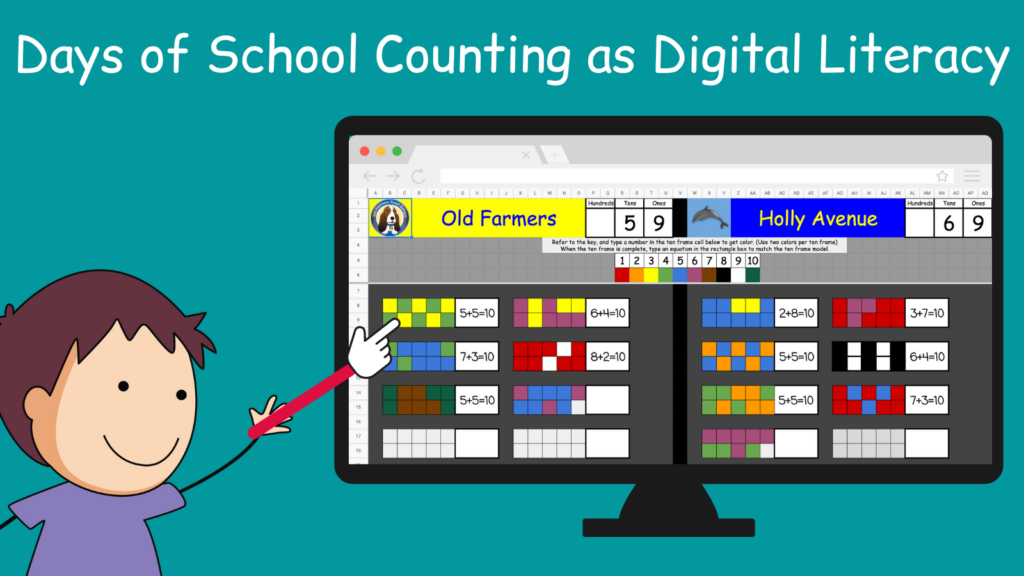
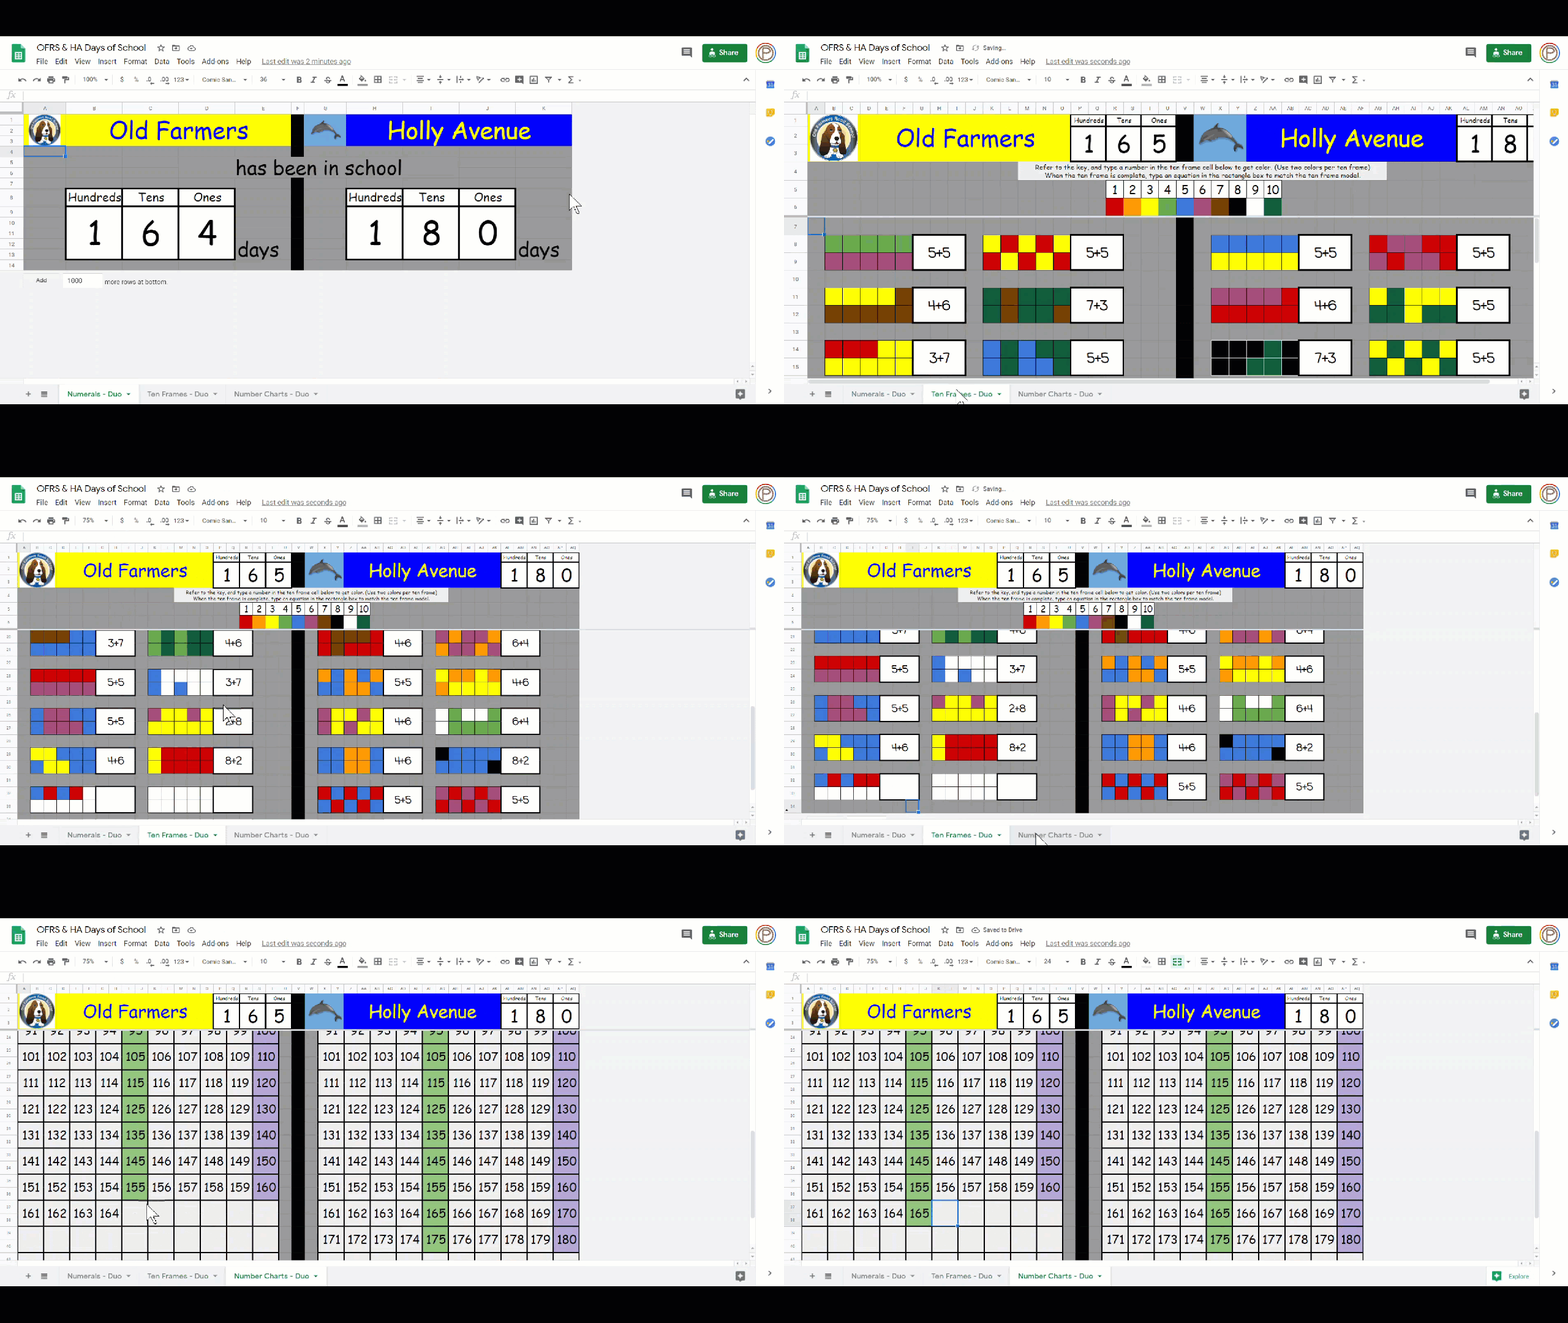
This blog post series focuses on the work of Faith Rogow, author of Teaching Beyond the Screen Time Debates: Practical Strategies for Integrating Media Literacy into Early Childhood Education. We continue to reflect on our time with Faith, and in this post, we focus on our Days of School Counting routine that we have reimagined as a collaborative cross-country experience. In Chapter 6 of our Innovating Play book, we go into detail about this math routine and provide the Google Sheets template for you to play too! In short, we have 3 sheets for 3 different ways to represent our days of school: digit/place value, ten frames, and a number chart. The GIF below takes you through the different sheets.
While we continue to use hands-on materials in the classroom to develop foundational math skills with a concrete focus, we also recognize that children live in a data rich environment. In bringing our classes together to consider numbers that are relevant to their world, we have the opportunity to enrich learning by organizing, visualizing, and analyzing in new ways.
How do we help children become literate in a digital world?
Faith Rogow
The task at hand is an educational task.
Keys Competencies for Media Literacy
In this post, we will continue to use the eight competencies that Faith introduced as key aspects of media and technology integration. The competency will be in bold and the description of the supporting question will be right next to it. You can view a table of the key competencies in our previous post.
Key Competencies Developed through
the Days of School Counting Routine
Comprehension: Do I know what I am looking at?
Students have the opportunity to explore how cells of a spreadsheet hold information that can be changed and updated over time. They discover conditional formatting as they observe changes in spreadsheet cells and patterns. This visual space lends to questions that allow students to communicate higher level mathematical thinking, while providing evidence within the spreadsheet to support their ideas.
Inquiry: What are my questions? How can I analyze the information?
Many questions arise as students compare data between classes. Having two sets of data opens up opportunities to both observe and compare meaningful data sets. Students practice using language to communicate their observations:
- I notice _______.
- I can see _______.
- When I compare ______.
- I discovered _______.
- I wonder ______.
- I am curious about ________.
Reflection: How does this technology/media make me feel: emotionally, mentally, physically?
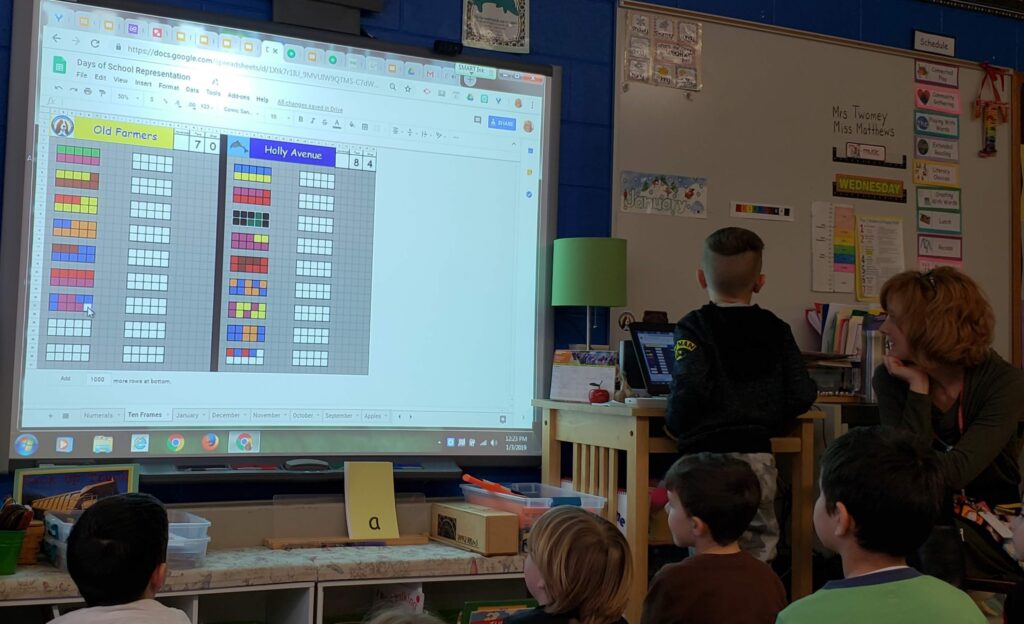
As the data pertains to the student experience, learners find joy and excitement in data and spreadsheet exploration! Having the class job of inputting the data is often one of the most popular jobs of the day.
Collaboration and Connection: How do I use technology to link to other people?
While classroom materials keep track of the days of school are limited to individual spaces*, a shared spreadsheet is a collaborative space that students use asynchronously to share data. This supports the understanding that people may have experiences that are both the same and different.
*We still have physical days of school charts in our rooms with straws to represent the number for the day of school.
Action: How can I appropriately and safely act on my reaction to something?
Students make connections between this space and other digital spaces that allow them to ask questions and share ideas between classes. A shared Seesaw class opens up possibilities to further connections linked to data.
Attention: What media is in my space?
Student experiences as a whole class in days of school data collection are transferred to individual experiences that allow them to extend their understanding independently. Some examples of student extensions are Google Sheets activities: Models and Equations and Seasonal Hidden Pictures.
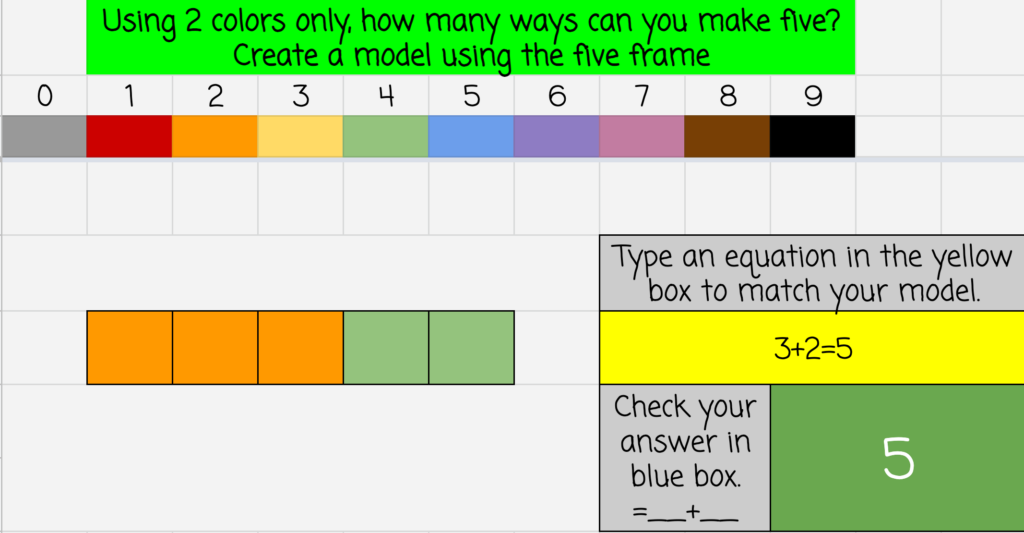
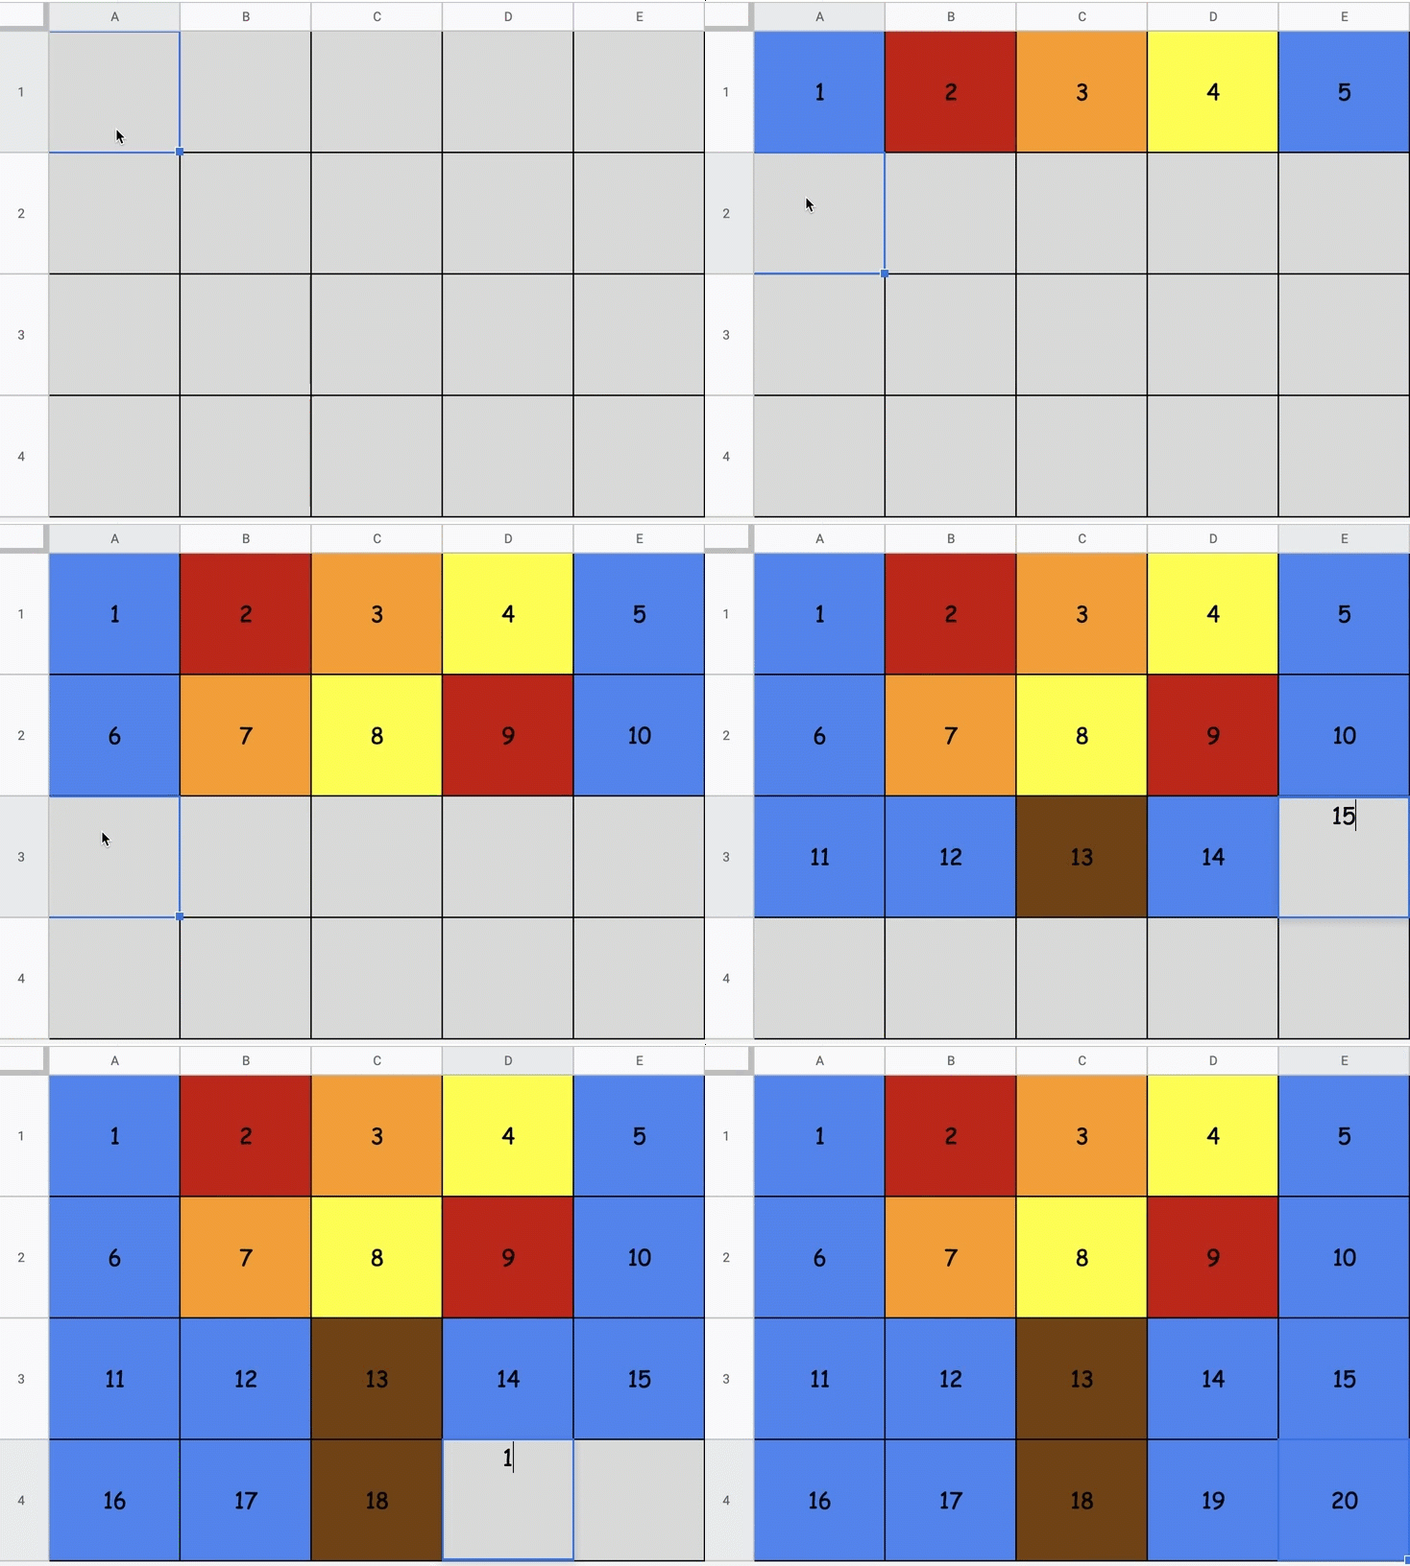
Creation: How can I make my own media? Engagement and Exploration: How can I safely explore my own ideas through play?
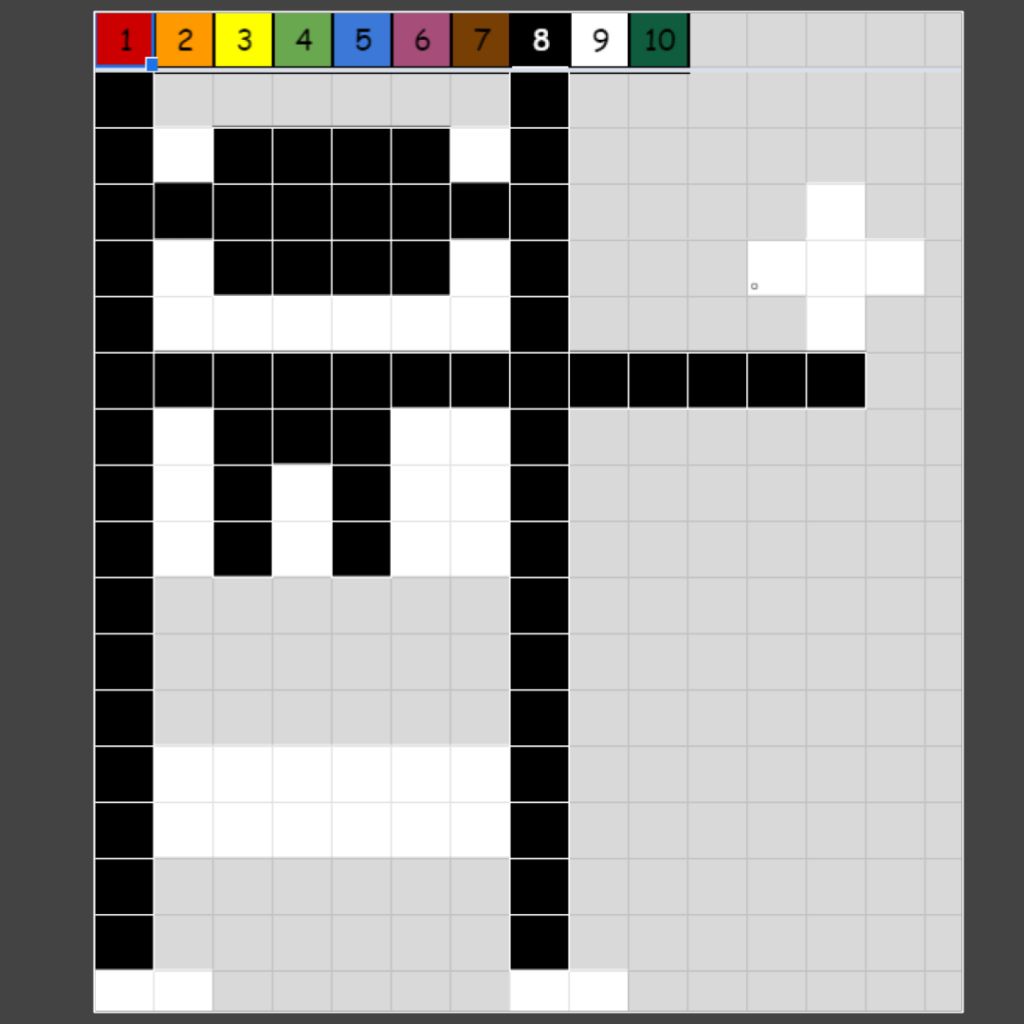
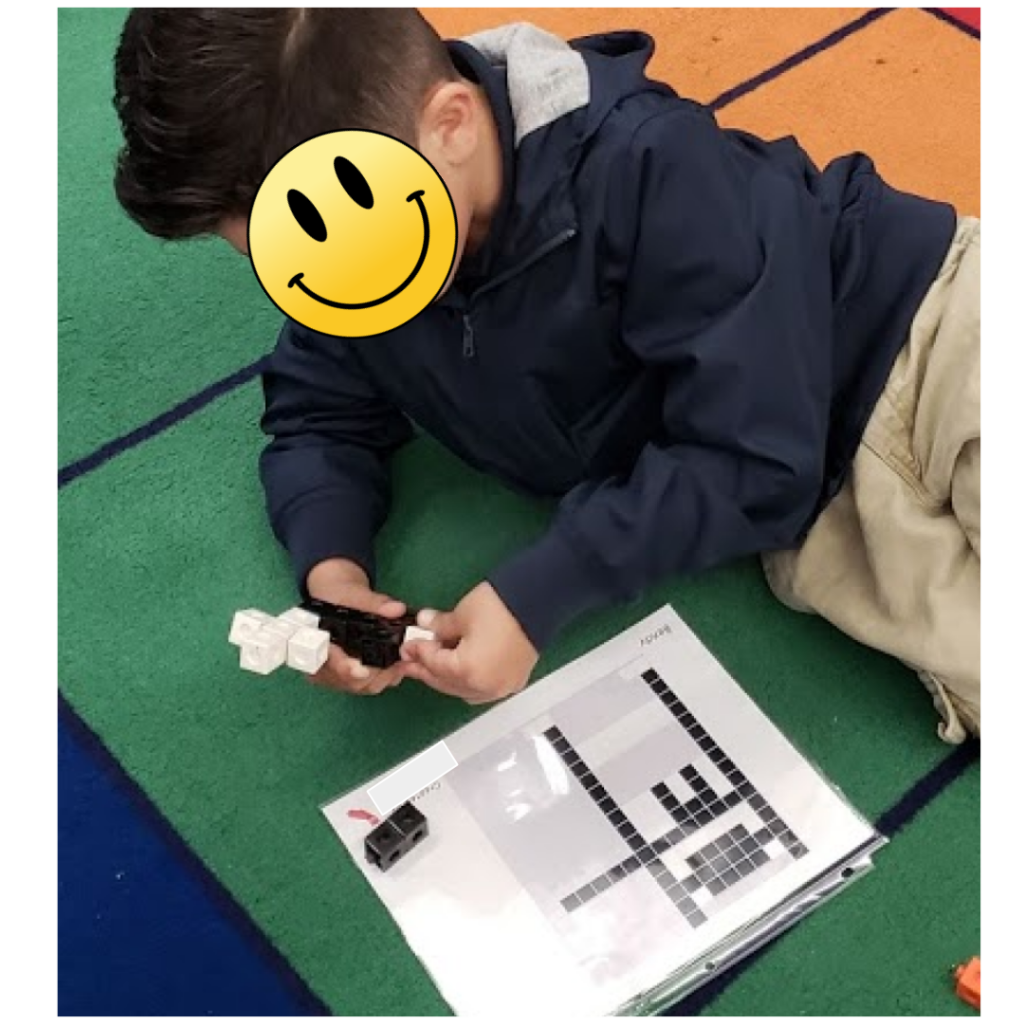
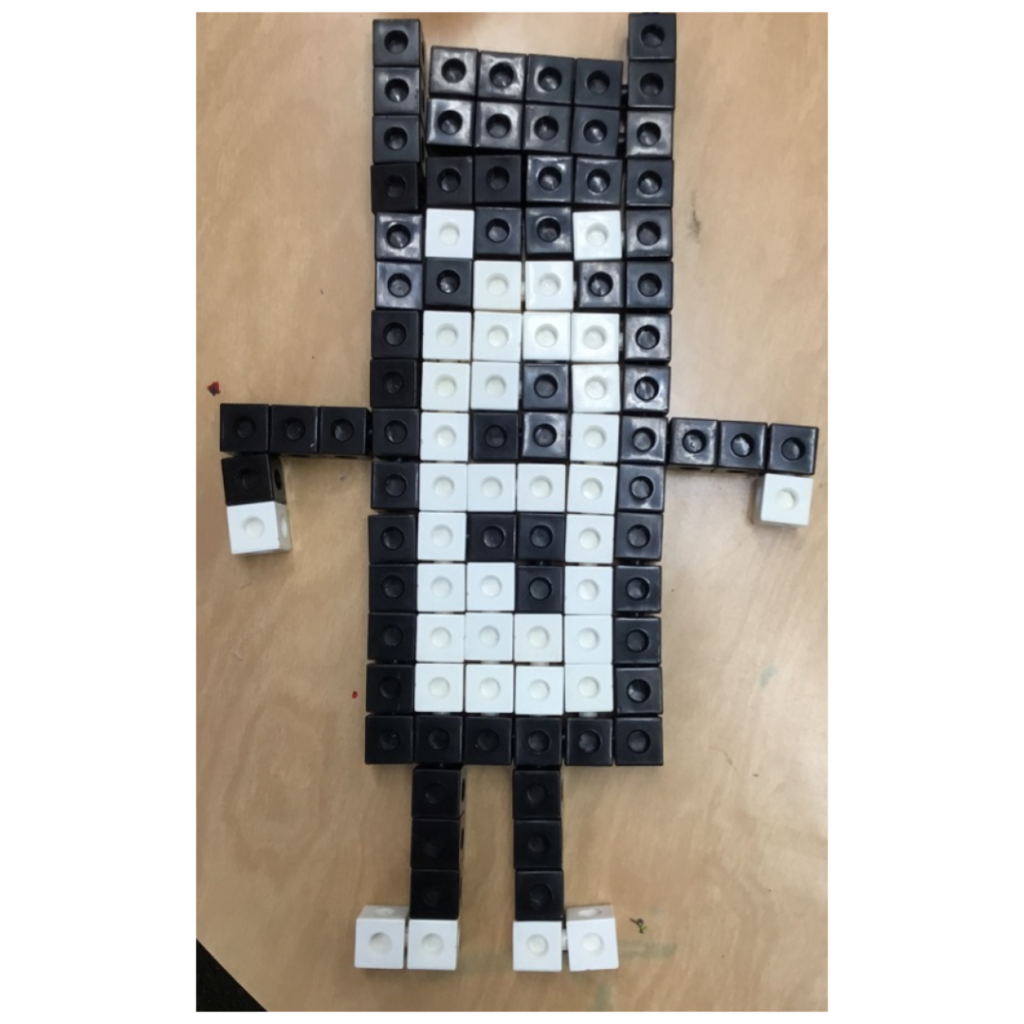
Once children have had exposure to working in a spreadsheet, they are ready for open-ended independent play! Pixel Art is a great first choice for exploration in Google Sheets. This can be combined with hands-on snap cubes for children to create and visualize in a variety of ways.
Reflection
Digital spaces, such as spreadsheets, don’t need to be limited for older student use! Sorting and organizing information in the world is a natural part of children’s development. Offering a variety of options to compare, analyze, and observe changes over time creates a safe and real-world opportunity for children to develop skills that will serve them over time.
If you found this blog post and provided ideas helpful, you might also be interested in exploring our other related resources. Simply click on either of the category images below to discover more!

